
Your operations meeting needs an answer: why is the backlog growing, and where should the team intervene? The data exists, but someone still has to find the right report, reconcile definitions, and assemble a view everyone can use. ChatGPT's Data agent offers another way to do that analysis. It does not remove the need to decide which numbers, people, and actions belong in the workflow.
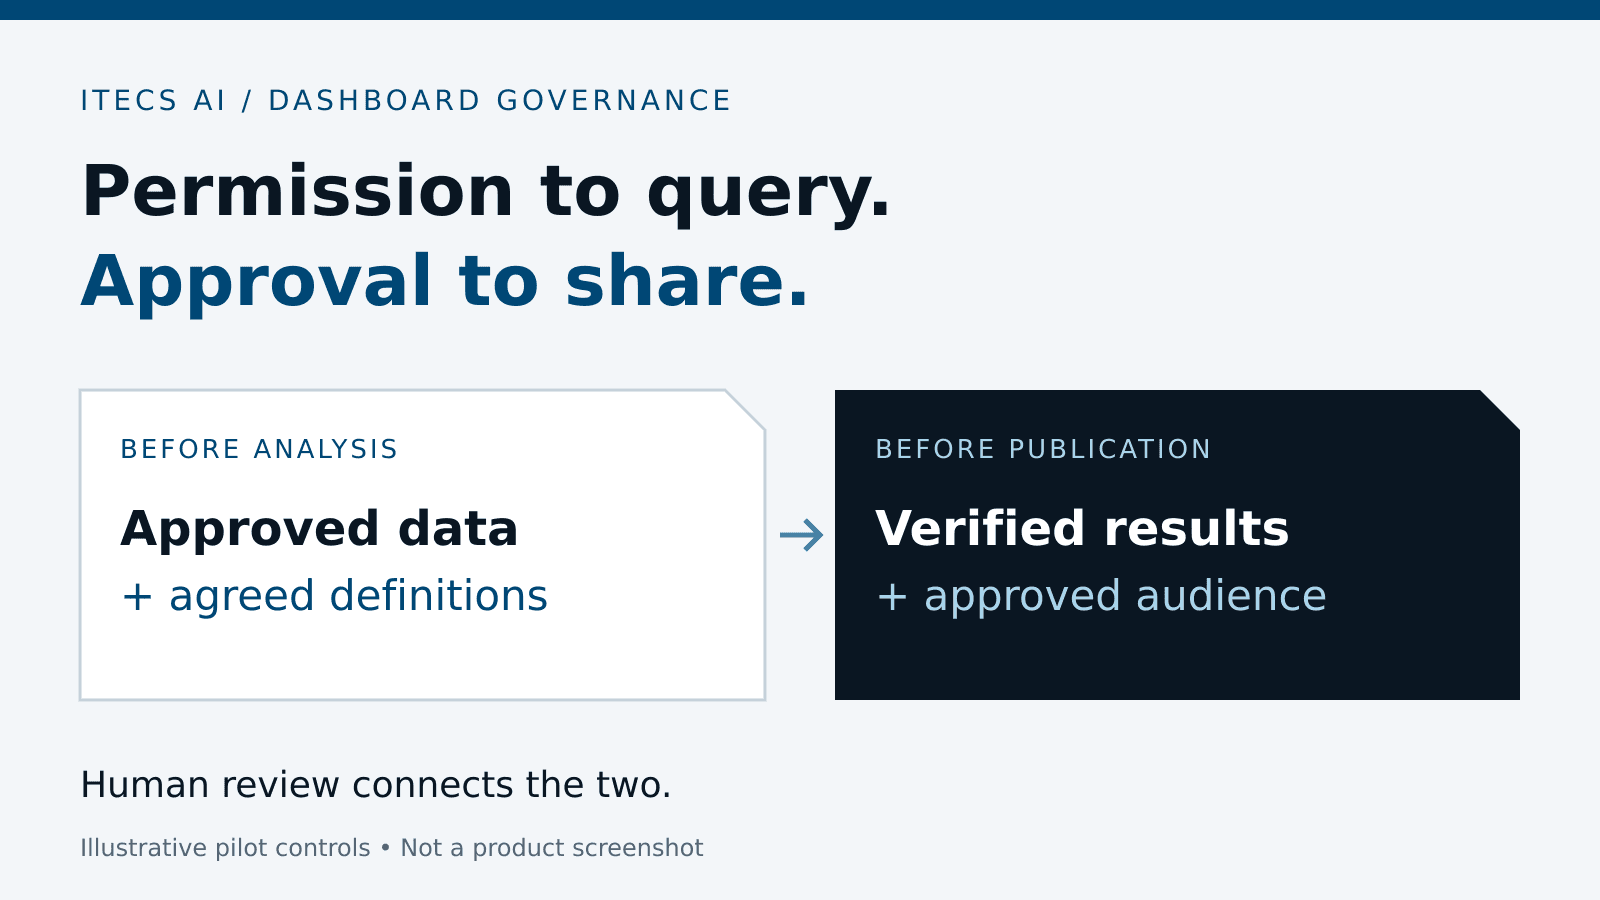
Start with one operational question, approved data, and a named analyst reviewer. Reconcile the answer with a trusted report, test access and refresh behavior, then approve the audience before publishing. Treat a useful exploratory dashboard as a draft decision aid—not automatically as an authoritative financial or compliance report.
This guide draws on product documentation checked September 18, 2026. The pilot controls and example below are ITECS recommendations, not claims that every control is built into the plugin or that a particular customer achieved a measured result.
What OpenAI and Sigma Released on September 10
OpenAI's September 10 announcement introduced the Data agent in ChatGPT Work, listed as Data in the plugin directory. It connects business sources, uses company definitions, supports follow-up analysis, and creates interactive dashboards. OpenAI names sources including Snowflake, Databricks, BigQuery, and Redshift, alongside document context. It says queries enforce the connected account's applicable table, row, and column restrictions. That is an access boundary, not a guarantee that an answer is correct.
Sigma's same-day announcement describes an expanded plugin for ChatGPT Work and Codex: users can move from questions to interactive Sigma dashboards, then refine their layout and filters. Sigma distinguishes dashboard building, which requires a Build license, from ask-and-query capabilities. Check your actual account permissions and workspace availability before promising this workflow to a department.
There is an important implementation limit behind the launch language. Sigma's current setup documentation says the plugin cannot share a workbook, configure exports, restore a previous version, or create data models. New workbooks are created in Your documents, not a shared folder. Plan a reviewed handoff into Sigma for supported sharing and administration rather than assume one chat prompt completes every step.
Set Up the Workspace Without Granting Everyone Everything
OpenAI's Data setup guide directs administrators to Workspace settings > Plugins, where Data can be made available or pre-installed for selected roles or groups. Enable the required source plugins separately; some connections need an administrator-configured app template. Users install Data if needed, authorize their sources, and begin with @Data. An installed plugin is not proof that its underlying app is connected or permitted.
OpenAI's workspace role guidance separates seats, administrative roles, custom feature roles, plugin controls, and source-system permissions. Owners configure RBAC and custom roles; a workspace role does not grant warehouse access. For your pilot, name a workspace owner for enablement, a data owner for source access and definitions, an analyst for verification, and a business owner for the decision and publication approval. These are responsibilities, not four new product roles you must create.
Use individual authorized identities and the minimum sources needed. Test a normal user's account, not just an administrator's. A table restriction determines which dataset can be queried; a row restriction can limit a regional manager to their region; a column restriction can hide compensation or identifiers. Include negative tests for each applicable boundary. A filter labeled Dallas is not a security policy if a viewer can simply remove it.
Sigma requires Use Sigma MCP with OAuth and the relevant operation permissions. Workbook creation requires Create, edit, and publish workbooks; editing also requires Can edit access. Do not expand access merely because an AI request fails.
Define the Metric Before Asking for a Chart
A semantic layer is the agreed meaning of your data: what a metric counts, which calculation it uses, and how tables relate. A conversational tool cannot resolve conflicting business definitions just by presenting one answer confidently.
Write a short metric contract. For overdue orders, specify whether the unit is an order or an order line, which promised date applies, which statuses are excluded, how partial shipments count, the reporting time zone, and when the source last loaded. Name the owner and link the approved model or report. If operations counts open lines while finance counts booked orders, preserve both definitions; do not blend them into a new unlabeled KPI.
Prefer an approved model or curated view over unrestricted raw-table exploration. Ask for source identifiers, calculations, joins, exclusions, and uncertainties with every finding. Resolve conflicting definitions with the owner before publishing. If these foundations are missing, a data readiness assessment is a better first step than connecting more systems.
A Practical Pilot: Investigate an Order Backlog
Consider an illustrative distributor whose operations lead wants to allocate next week's expediting effort. This is a hypothetical planning exercise, not an ITECS customer result. The pilot uses an approved order-line model and the existing operations backlog report. It does not authorize changing orders, emailing customers, or making purchases.
A useful starting request is: ‘@Data Investigate overdue open order lines for the last four complete weeks, compared with the preceding four. Use our approved backlog model and its overdue definition. Show the source, query or calculation, reporting time zone, filters, and last data-load time. Separate observed changes from possible explanations. Draft a dashboard for operations review; do not publish, export, send messages, or change source records.’ Treat these instructions as the task brief; enforce access and action limits in the workspace and connected systems as well.
- Agree on the decision. The operations lead names the expediting decision, the approved report, the comparison periods, and acceptable reconciliation differences before analysis begins.
- Verify the source and calculation. The analyst reviews joins, aggregation grain, duplicate handling, exclusions, time zones, and null values. Match totals and selected records to the trusted backlog report using the same cutoff.
- Challenge the explanation. Distinguish a measured increase from a proposed cause. Check whether a status change, late data load, or changed promise-date definition explains the apparent trend. Do not present correlation as causation.
- Exercise the dashboard. Test region, product, and period filters across every chart and total. Verify freshness, empty states, and expected denials using representative restricted accounts.
- Approve the audience and action. The data owner checks included fields and recipients. The operations lead approves the reviewed view and decides what action to take. Complete sharing in the destination's supported controls.
- Record and repeat. Keep the accepted query or calculation, reconciliation evidence, owner, version, and update procedure. Run the next cycle against the same acceptance criteria and record any changes.
A realistic failure is a join from order lines to multiple shipment events that doubles the overdue total. The analyst checks the query's grain and distinct identifiers, corrects the aggregation, and reruns the comparison. Record the defect and corrected result. A chart can look perfectly plausible while counting the same business item twice.
Publication Is a Separate Data-Access Decision
OpenAI's Data guide says Sites publication copies analysis data into the site. It describes cloud automation for subsequent updates. Our recommendation: approve the copied content and audience separately, and test the update mechanism before anyone depends on it. A successful query is not publication approval.
For each publication destination, record what is stored, who can view it, who can edit it, and which identity supplies future data. For a Sigma workbook, complete supported sharing in Sigma and verify the resulting access there. For a copied site or export, review the actual included data rather than assume it will reapply each viewer's warehouse permissions. Keep external links and broad workspace sharing out of the initial pilot unless the data owner specifically approves them.
Require explicit approval before broadening an audience, exporting sensitive rows, sending findings to Slack or email, changing metric definitions, scheduling unattended work, or taking operational action. Review both the content and destination. An analyst may approve a calculation without having authority to distribute it to everyone. Our ChatGPT workspace governance checklist covers the wider administrative context.
Test Filters and Refresh, Not Just the First Screenshot
Change every dashboard control and confirm which charts it affects. Test a blank selection, multiple selections, boundary dates, no matching records, and a restricted user. A region filter that changes the chart but not its KPI tile can create a contradictory management report. Label units, denominators, comparison periods, and incomplete periods visibly.
Separate source freshness, query execution time, and dashboard publication time. Test a known approved source update through to the displayed result, then test what happens when access expires or refresh fails. The dashboard should expose stale or unavailable data, not quietly invite a decision from an old number. If live refresh is not supported for your chosen destination, document the manual update procedure and its owner.
Sigma's refresh guidance describes workbook refresh on opening or refreshing and configurable schedules with the relevant permissions. It warns that repeated queries can create warehouse load and cost. Choose a cadence that matches the decision: a weekly staffing review rarely needs minute-by-minute queries. Verify the actual connection, caching, and schedule settings rather than treat the word live as a freshness guarantee.
Keep a Change Record and Measure Useful Work
Keep the original question, source/model identifiers, definition version, generated query where available, filter state, refresh configuration, reviewer, approval, destination, and dashboard version in an access-controlled record. Link to provider query history and audit events where your plans expose them. If a tool does not expose a needed query or audit trail, record that limitation and keep the output exploratory. Do not dump credentials or unrestricted result rows into logs.
Before the pilot, time the existing workflow from question to an accepted answer. During the pilot, measure analyst preparation, AI iteration, reconciliation, correction, and publication effort together. Net analyst time saved is the previous hands-on time minus the new hands-on time—including review. Record query and platform costs separately. Faster first drafts can still create more work overall.
Evaluate decision quality with the business owner: Did the dashboard answer the agreed question? Did it identify an actionable exception? Were decisions reversed because the numbers were wrong or stale? Track reconciled results, rework, permission-test failures, and decisions accepted with evidence. Do not substitute prompt counts or attractive charts for dependable work completed. Expand only when the pilot meets the owner's written quality and access expectations.
Exploration Is Not Authoritative Reporting
Use early dashboards to investigate, compare, and prepare questions. Do not treat them as approved financial statements, regulatory submissions, or compliance evidence merely because they use governed data. Those outputs need their existing accountable review, period controls, reconciliations, retention requirements, and sign-off. Involve finance or compliance before designating a dashboard authoritative; this workflow guide does not determine your legal reporting obligations.
Keep three states visible: exploratory draft, reviewed operational dashboard, and separately approved authoritative report. Assign an owner, review date, and retirement condition to each maintained dashboard. Revalidate after a model, plugin, source schema, permission, metric definition, or refresh configuration changes. The useful outcome is not unlimited dashboard creation. It is a repeatable path from a business question to an answer the right people can inspect and responsibly use.